Research Brief
Industrial Outlook
November 2026

Range of Macroeconomic Factors Support Industrial Space Demand
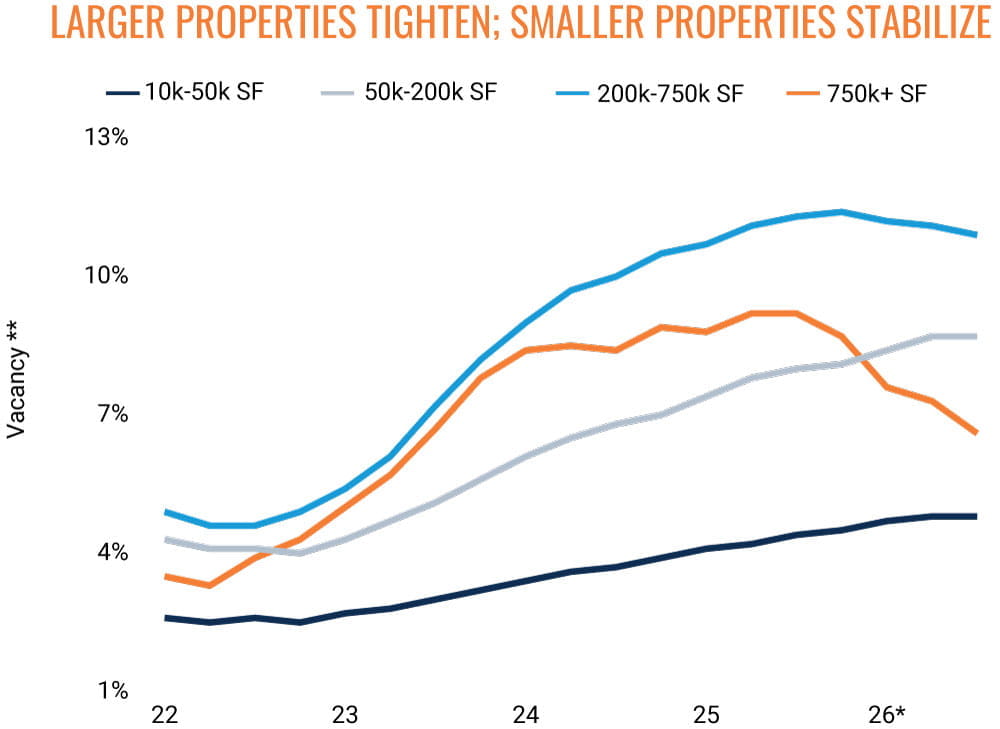
Industrial space demand growing, but unevenly. Despite trade uncertainty, elevated fuel costs, and other disruptions, industrial demand has strengthened, with annual net absorption on pace for its highest level since 2022. Across logistics and manufacturing properties, a flight to quality remained apparent. Vacancy among post-2020 warehouse-distribution facilities fell 420 basis points in the year ended September, while newer manufacturing properties continued to capture demand. Larger buildings also outperformed, with vacancy among properties of at least 750,000 square feet falling 260 basis points over the same period. Meanwhile, smallbay vacancy stabilized, potentially supported by demand from local service-oriented businesses. National vacancy fell to 7.6 percent in the third quarter, its first quarterly decline since 2022, while a comparable pace of fourth-quarter deliveries may help sustain the improving supply-demand balance.
Logistics properties maintain strength. Against a backdrop of resilient consumer spending and improving manufacturing activity, U.S. intermodal rail volumes reached a quarterly record, while 17 of 20 major carload categories registered annual gains in September. At the same time, warehouse-distribution leasing activity increased roughly 20 percent in the year ended September. Continued data center development may support additional demand as equipment suppliers and contractors increasingly lease nearby logistics space. Lean inventories and faster turnover among retailers could also sustain distribution demand while potentially tempering the need for additional warehouse space. Yet subdued trucking volumes and a 32 percent year-over-year increase in shipper spending point to tighter carrier capacity and elevated freight costs that could constrain future logistics expansion.
 Manufacturing activity outpaces space demand. Durable goods new orders and shipments both rose nearly 10 percent in the year ended September, while core capital goods registered even larger gains. Manufacturing staff counts also returned to growth after three consecutive years of declines, adding 101,000 jobs through October. Yet improving sector conditions have not translated into a comparable recovery in real estate demand, as manufacturing leasing volume declined 18 percent quarter-over-quarter and vacancy edged higher despite reduced deliveries. Below-average capacity utilization suggests some manufacturers may have room to increase production within existing facilities before requiring additional space. Elevated input costs may also be tempering some expansion plans, as September’s ISM Manufacturing Prices Index rose 6.8 points. Near-term speculative supply exposure remains limited, however, with roughly 70 percent of remaining 2026 deliveries already preleased.
Inland markets maintain growth trajectory. Across the Midwest, manufacturing expansion and inland distribution demand supported broad vacancy compression, led by Indianapolis, Columbus, and Milwaukee. Southern California fundamentals strengthened alongside robust growth in loaded TEU imports. In the Southwest, Phoenix and Las Vegas made further progress digesting recent supply, while Pacific Northwest markets such as Portland and Seattle-Tacoma weakened amid negative absorption. Along the Northeast/Mid-Atlantic corridor, Philadelphia improved, while vacancy rose in Boston and New York.
Transactions continue to pencil despite challenges. Improving occupancy and renewed rent growth helped sustain deal flow in the third quarter despite rising borrowing costs. Transactions increased roughly 15 percent in the year ended September, led by nearly 20 percent growth among deals above $20 million, while pricing rose modestly to about $138 per square foot. Looking ahead, economic uncertainty and sustained deliveries could constrain some tenant expansion and intensify leasing competition. Still, improving fundamentals amid persistent headwinds provide a constructive investment backdrop entering 2027.
87.5 Million SF |
10.3% |
|
Greatest Quarterly Net Absorption Since 2022 |
Y-O-Y Rise in Loaded TEU Imports in September |
* Through 3Q ** Warehouse-Distribution only | Sources: Marcus & Millichap Research Services; American Trucking Associations; Association of American Railroads;
Bureau of Labor Statistics; Bureau of Transportation Statistics; CoStar Group, Inc.; Descartes Datamyne; Federal Reserve; Institute for Supply Management; U.S. Bank; U.S. Census Bureau
TO READ THE FULL ARTICLE