Research Brief
Economic Divergence
October 2026

Not All Signals Point the Same Way, Requiring a Look Beyond the Headlines
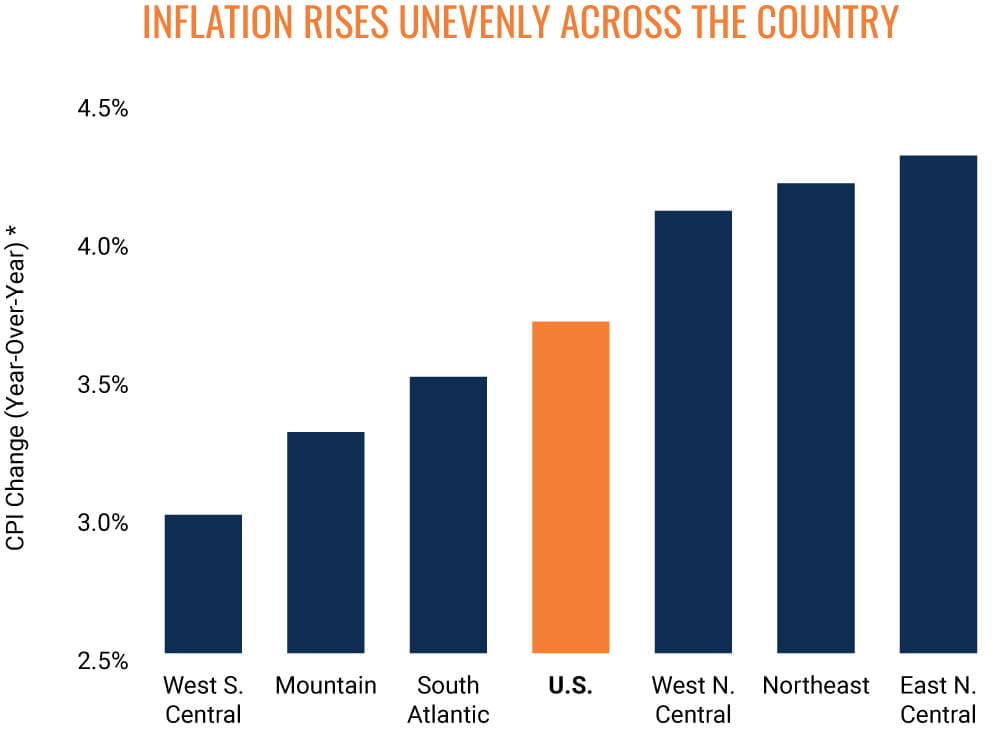
Cost trends diverge across regions. Recent readings highlight a geographic disparity in inflation, with households and businesses facing different economic conditions across the country.
- The September U.S. Consumer Price Index rose 3.7 percent year over year, up from 3.4 percent in August.
- The Producer Price Index increased 6.3 percent year over year, reflecting continued price pressures on businesses.
- Energy inflation rose 20.4 percent over the year, making it a primary contributor to overall inflation.
- Transportation inflation increased 7.8 percent, adding further pressure to consumer and business costs.
- Despite these national trends, inflation remains below the U.S. rate in several metros, including Houston at 1.3 percent, Tampa at 1.9 percent, and Phoenix at roughly 2.5 percent.
- Higher rates persist in other markets, including Hawaii at 5.2 percent, San Diego at 4.7 percent, and New York at 4.5 percent.
- Diesel prices also vary considerably, ranging from roughly $5.60 to $5.80 per gallon across several Southern states, compared with about $8.50 per gallon in California.
- National averages do not fully capture local economic conditions, underscoring the importance of market-level analysis.
Broad metrics do not always explain market-level trends. Looking beyond headline indicators reveals substantial differences across geographies, sectors, and individual properties.
- Rising inflation and interest rates are creating broad-based headwinds for commercial real estate.
- Yet, economic pressures, including inflation, slowing job growth, and higher interest rates, do not affect every market equally.
- As such, market conditions can vary considerably by metro, submarket, and individual asset.
- Property fundamentals and investment performance can diverge significantly from national trends.
- As a result, select CRE investments can offer compelling opportunities, despite broader economic headwinds.
A shifting landscape favors selectivity. Evolving valuations and longer-term tailwinds are reshaping the outlook for well-positioned commercial real estate.
- Office properties traded hands over the past year at a mean cap rate of 7.6 percent, ranging from 6.3 percent to 9.1 percent.
- Some partially leased office spaces are trading at double-digit yields, offering potential upside through improved occupancy.
- The average cap rate for multifamily trades was 6.3 percent, ranging from approximately 5.2 percent to 7.8 percent.
- Retail cap rates span roughly 240 basis points, with even wider spreads across industrial, self-storage, and hospitality asset.
- CRE borrowing rates currently rest in the mid-6 percent band for agency multifamily loans to the mid-7 percent range for other financing, depending on the property and borrower.
- Higher debt costs could place additional upward pressure on cap rates in the coming months.
- Motivated sellers are adjusting expectations, creating selective investment opportunities.
- Market headwinds vary by property type and location, making deal-level analysis essential.
- As these headwinds subside, demographic trends, slowing construction, and pent-up demand could strengthen leasing and improve property fundamentals.
* Data as of September 2026, not seasonally adjusted
Sources: Marcus & Millichap Research Services; American Automobile Association; Bureau of
Labor Statistics; CommLoan; CoStar Group, Inc.; Federal Reserve; Real Capital Analytics
TO READ THE FULL ARTICLE