Research Brief
Midyear Industrial Outlook
August 2026
Industrial Fundamentals Find
Footing as Trade Uncertainty Clouds Outlook
Demand faces crosscurrents. Consumer spending continues to support industrial space absorption, though transportation costs and fluid trade policy are creating uncertainty for importers.
- Headline retail sales increased 6.7 percent year-over-year in June, supported by a 14.2 percent rise in non-store sales, which continues to drive warehouse demand.
- Supply chain costs have risen sharply, with shipping a container from East Asia to the U.S. West Coast increasing from approximately $1,850 before the Middle East conflict to more than $7,000 in mid-July.000
- Domestic trucking costs are also up 35 percent since February, increasing transportation expenses and placing upward pressure on inflation
- E-commerce, sporting goods, and electronics retailers posted the strongest spending growth during the first half of the year.
- Elevated transit costs may affect how retailers and manufacturers manage inventory and plan future imports.
- Tariff uncertainty persists as new Section 301 tariffs replaced the temporary Section 122 tariffs, complicating inventory decisions ahead of the holiday season
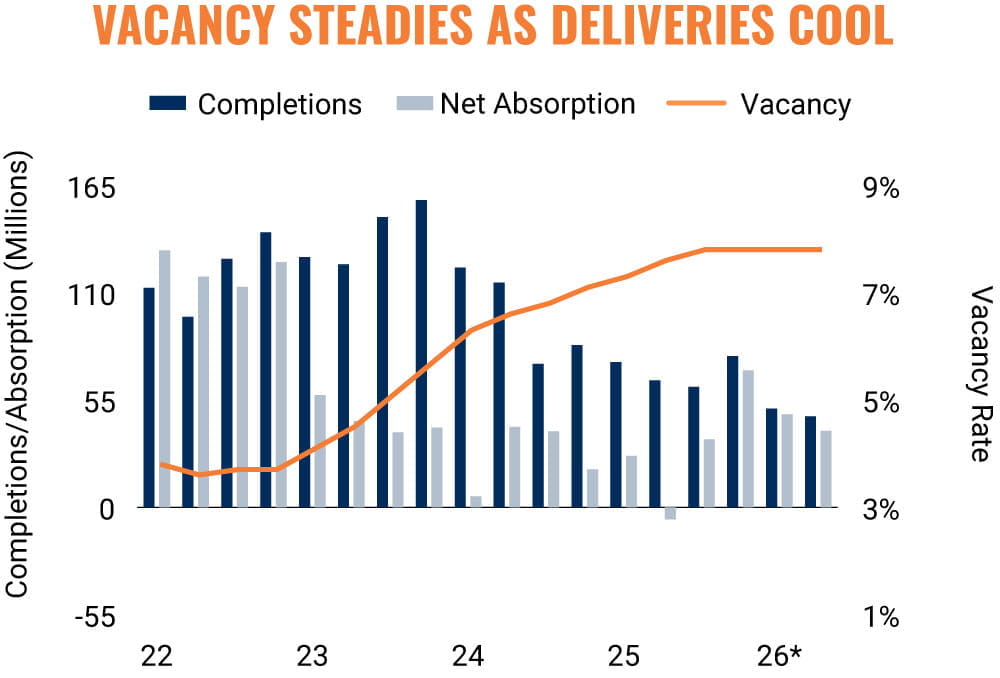
Industrial conditions hold relatively steady. Though new supply continues to outpace demand, development is trending down, allowing vacancy to remain steady
- Industrial net absorption moderated in the second quarter but remained well above year-ago levels, when the first round of tariffs was announced.
- Deliveries totaled 46.6 million square feet in the second quarter, the lowest quarterly volume since 2014
- Slower development activity helped stabilize the national industrial vacancy rate at 7.8 percent.
- Vacancy rates for warehouses larger than 200,000 square feet continued to decline in the year ended June.
- Smaller warehouse properties experienced rising vacancy rates, although facilities under 50,000 square feet maintained the lowest vacancy rate at 4.6 percent.
- Industrial rents remained largely unchanged, with average asking rents matching mid-2023 levels and standing just 0.5 percent above the second quarter of 2025.
Capital continues to target industrial. Deal flow has continued to rise as market participants look beyond near-term economic and supply-chain disruptions.
- Investor interest in industrial properties remains strong despite relatively muted rent growth.
- Industrial transaction activity increased over the past year, extending a multiyear trend of growing investment in the sector.
- Average industrial cap rates increased from a low of 6.0 percent in 2022 to 6.8 percent in the second quarter
- These trends highlight the resiliency of industrial investment despite economic volatility, supply chain disruptions, and an ever-evolving global trade environment.
- Continued growth in consumer spending and e-commerce activity suggests long-term demand for industrial warehouse space will continue to increase.
10%-12.5% |
7.8% |
|
New Tariffs Imposed on |
U.S. Vacancy Has Held at |
* Through June | Sources: Marcus & Millichap Research Services; Bureau of Economic Analysis; Bureau of Labor Statistics;
CoStar Group, Inc.; DAT Freight & Analytics; Freightos; Real Capital Analytics; U.S. Census Bureau
TO READ THE FULL ARTICLE