Improving Fundamentals Reinforce the Importance of Market Selection
White-collar job growth remains subdued. Although total U.S. employment increased by 426,000 in the first seven months of 2026, office-using employment declined by 12,000 positions. If this trend continues through year-end, it will mark the fourth consecutive year of white-collar job losses, though at a much slower pace than the roughly 200,000 roles lost annually between 2023 and 2025. Still, incremental gains in workplace attendance are helping offset some hiring-related headwinds for office utilization. Hybrid work setups remain common, supporting demand for dedicated workstations and helping workplace usage trend higher.
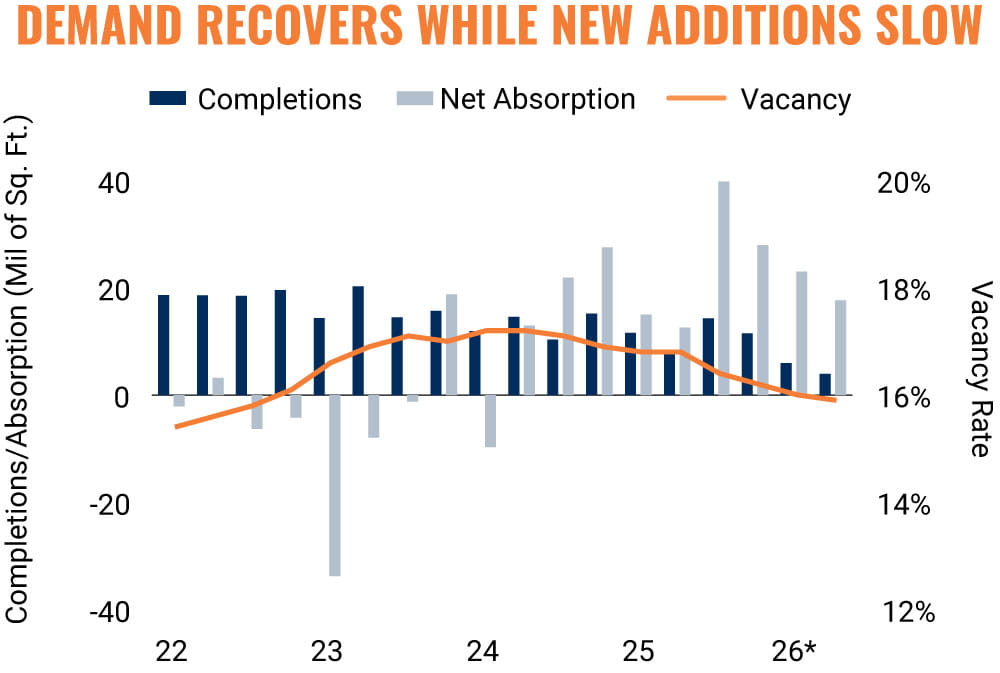
Net absorption continues to improve, aiding vacancy. The second quarter of 2026 marked the ninth consecutive quarter of positive net absorption of office space nationally. Additionally, only 10 major U.S. markets, most of which are in the Midwest, saw net space relinquishment in the first half of 2026, This overall improvement in office space demand coincides with a delivery pipeline that has been shrinking since the pandemic. The combination of these supply-demand dynamics should continue to compress vacancy. As of June, nationwide office vacancy stood at 15.8 percent, 140 basis points below the peak levels in early 2024, but still notably higher than the five-year average from 2015 to 2019 of 12.7 percent. Continued demand gains alongside limited new supply should extend this recovery in the near term.
Bifurcation across markets becomes more evident. The strongest gains in net absorption and vacancy compression over the past four quarters were concentrated in major office hubs, most notably the San Francisco Bay Area, New York City, and Southeast Florida. These markets benefit from large concentration of employers in finance, technology, and business services, sectors that increasingly favor gateway locations with deep talent pools and global connectivity. Sun Belt hubs outside of Florida such as Atlanta, Phoenix, and several Texas metros saw higher leasing activity than pre-pandemic norms, though average deal sizes were below 2015-2019 means. In contrast, Philadelphia, Washington, D.C., Chicago, and San Diego experienced weaker leasing momentum and more muted vacancy declines. While these markets also have substantial office inventories, many have a greater share of demand from specialized industries such as government, health care, and life sciences, which have generated less leasing momentum during the current cycle. Taken together, these trends suggest that office performance is becoming increasingly tied to market-specific competitive advantages rather than broad-based national demand drivers.
Key Takeaways
• White-collar hiring remains weak through midyear, though improved workplace attendance and hybrid work models continue to support demand for office space.
• Limited construction and ongoing inventory reductions are helping to rebalance market conditions, allowing vacancy rates to trend lower nationwide.
• Class A vacancy, despite declining from its 2023 peak, remains well above that of Class B and C properties. However, much of the availability is increasingly concentrated in a smaller subset of underperforming buildings.
• Industry composition is increasingly influencing office performance, with major gateway markets posting the strongest leasing and absorption trends
9.9 Million SF
|
40.7 Million SF
|
|
Lowest First-Half Delivery
Total Since At Least 2000
|
Largest First-Half Net
Absorption Since 2019
|
*Through 2Q | Sources: Marcus & Millichap Research Services; Bureau of Labor Statistics; CoStar
Group, Inc.; Placer.a