Research Brief
Retail Sales
June 2026

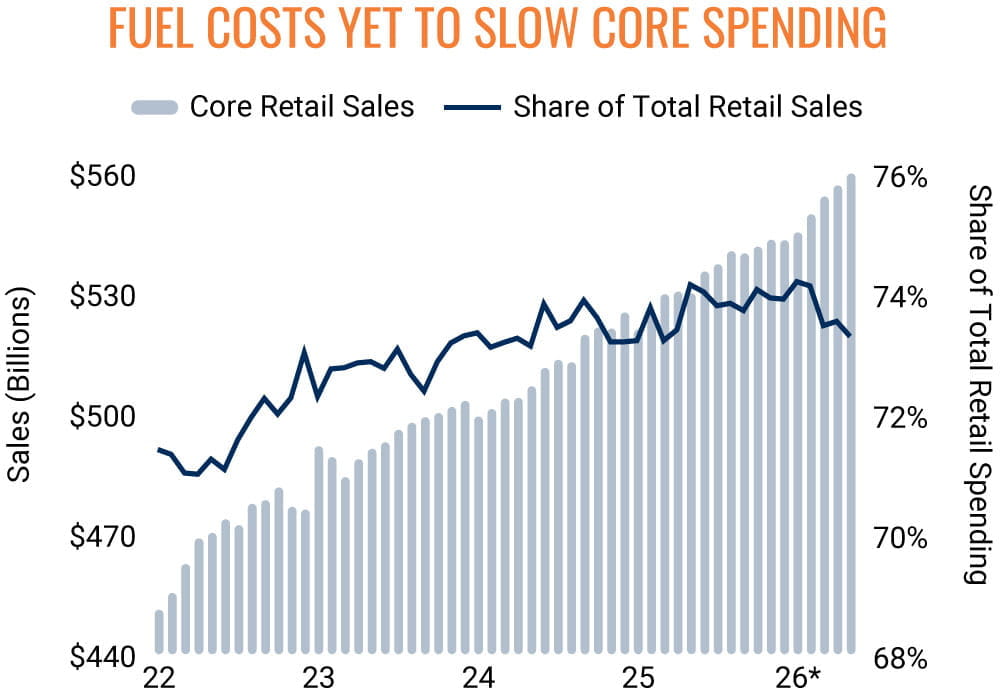
Steadfast Consumer Spending Translates to Record Core Retail Sales
Spending reflects a more budget-conscious shopper. Households continued to spend in May despite elevated fuel prices and persistent price pressures, with core retail sales up 0.5 percent monthly and 5.6 percent annually. Spending rose in real terms on both fronts, supported by limited cost pass-through by retailers, consumers’ resilience, and more households drawing on savings to cover daily expenses. Positive spending momentum, however, was not universal across core retail categories. Instead, general merchandise, miscellaneous retail, and online stores registered record sales, while restaurant and electronics-related spending dipped amid discretionary budget-trimming by certain consumers. With headline inflation outpacing wage growth for a second straight month, more households could curtail how often they dine out and make big-ticket purchases. Others will continue to draw on savings; however, the nearly four-year low in the personal savings rate in April suggests that spending power for some households may erode this summer.
Inflation may be easing. Energy prices remained elevated last month; however, this upward pressure did not significantly spill into other categories. Instead, core CPI and food-at-home pricing rose just 0.2 and 0.1 percent, respectively. Since then, consumers have felt some relief at the pump as the average price of gas fell below $4 per gallon in mid-June for the first time since March. With the Strait of Hormuz potentially reopening to commercial shipping traffic within 30 days, fuel costs may continue to fall, which would slow inflation momentum and help to preserve consumer spending. Still, economists caution that it will take time for oil flows to return to pre-war levels, with retailers still facing higher expenses for ocean freight and air cargo over the near term.
Categories synonymous with discounts shine. Spending online increased 1.5 percent last month, up an impressive 12.2 percent annually. As such, one-fourth of all core retail sales now take place online, highlighting the importance of supply chain efficiency for omnichannel retailers and the challenging environment for some smaller brick-and-mortar shops. In June, the non-store retail category is slated for another record month, as Amazon Prime Day has been moved to June 23-26 — an event that netted a record $24.1 billion in sales across U.S. retailers last year. While apparel related purchases will drive a portion of this spending, consumers seeking lower-priced clothing are also turning to thrift stores. Since early last year, foot traffic at these shops has consistently outperformed that of traditional and luxury apparel shops, supporting spending across miscellaneous retail that was up 9.1 percent year-over-year in May.
Commercial Real Estate Outlook
Major retailers navigate challenging environment. After-tax profits of U.S. retail corporations with assets of at least $50 million totaled $64.5 billion in the first quarter of 2026, up nearly 40 percent year-over-year. The notable rise in net income occurred alongside 4.7 percent year-over-year sales growth. This divergence indicates that these larger retailers are scaling operations and improving efficiency to expand their after-tax profit margin, which was 5.7 percent in the first quarter. Moving forward, some retailers may scale their operations by closing underperforming stores while concurrently opening smaller, well-located locations.
Trajectory of tenant demand shifts. Preliminary data for the second quarter of 2026 point to a return to positive retail absorption after tenants relinquished a net of 4.2 million square feet during the first three months of this year. Increases in both single- and multi-tenant demand are driving the improvement, with department store and power center leasing noteworthy. This signals demand for vacant big-box space, with a mix of off-price and experiential tenants backfilling these layouts.
5.6% |
0.5% |
|
Year-Over-Year Rise in Core Retail Sales |
May Increase in Core Retail Sales |
Sources: Marcus & Millichap Research Services; AAA; Adobe; CoStar Group, Inc.; Internal Revenue
Service; Placer.ai; U.S. Bureau of Economic Analysis; U.S. Bureau of Labor Statistics;
U.S. Census Bureau
TO READ THE FULL ARTICLE