Research Brief
Inflation
January 2026

Modest Goods Pricing and Sticky Services
Favor Tenants With Low Labor Needs
Goods prices stabilize as trade dynamics evolve. While goods inflation held flat in December on a month-over-month basis, it was up 1.4 percent year-over-year, well above the deflation seen in early 2025. Tariff-related cost pass-through remains an upside risk, though greater near-term clarity around trade barriers and ongoing supply-chain realignment may help limit price pressures. In December, the administration suspended a planned increase in tariffs on furniture and select goods from 25 percent to 50 percent, easing concerns over escalating costs. At the same time, firms are committing to longer-term adjustments, with companies such as IKEA pursuing expanded U.S. production, including a new $70 million domestic manufacturing facility. Over time, increased onshoring should help reduce volatility in goods prices, even as trade policy remains uncertain..
Labor intensity shapes services pricing. Core services, which exclude energy services, increased by 0.3 percent in December, driven by persistent inflation in shelter and labor-heavy categories such as health care. Nevertheless, the year-over-year pace held at 3.0 percent, down materially from levels above 4.0 percent in early 2025, underscoring a gradual disinflation trend. Service providers with lower labor requirements are likely to remain less exposed to cost pressures, as evidenced by club membership fees rising only 0.4 percent year-over-year. This dynamic has reinforced investor demand for net-leased fitness centers, where fourth-quarter transaction activity climbed to multiyear highs, supported by their recurring revenue models and segment vacancy holding near 2 percent.
Venezuelan Oil Could Help Keep Energy Costs
in Check, Shaping Regional Spending Patterns
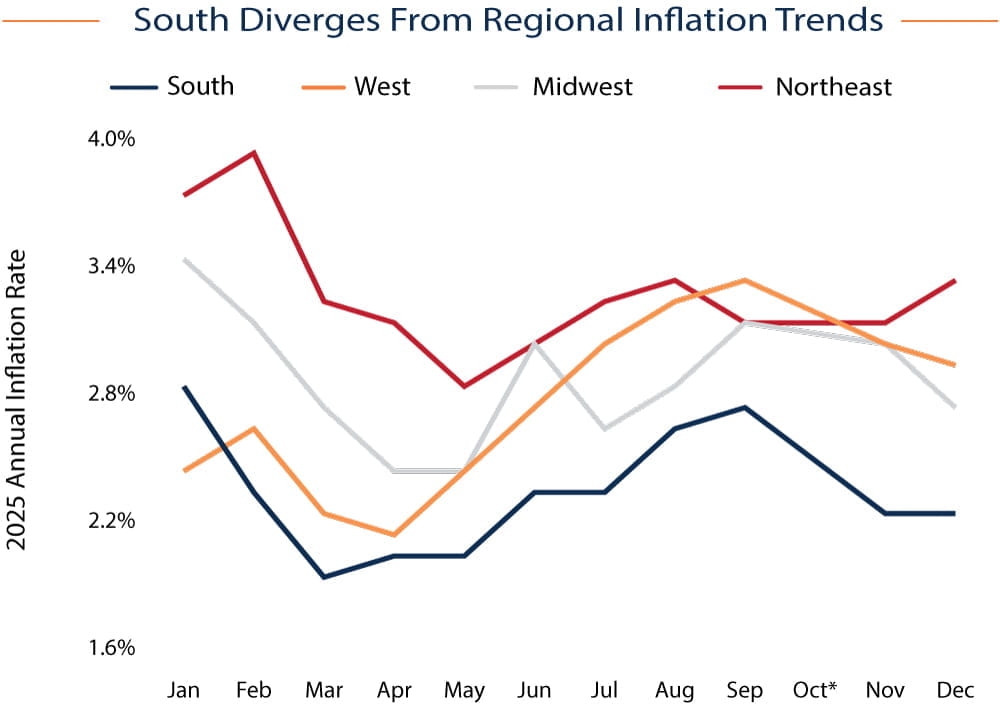
Southern energy costs remain favorable. Energy pricing continues to diverge across regions and is likely to shape spending patterns going forward. In November, the energy index in the South rose 2.0 percent year-over- year, compared with increases above 4.0 percent in other regions. Proximity to Gulf Coast production and a more favorable regulatory environment continue to anchor lower gasoline and electricity costs across the South. This advantage should support stronger consumer spending and may enhance the region’s appeal to manufacturing and industrial tenants seeking lower operating costs.
2.7% |
2.6% |
|
Increase in Headline |
Increase in Core CPI 3.0% |
* October data estimated using the average of September and November readings.
Sources: Marcus & Millichap Research Services; Bureau of Labor Statistics; CME Group;
Federal Reserve; CoStar Group, Inc.; RealPage, Inc.
TO READ THE FULL ARTICLE